Problem Statement
Football has been the world’s most popular sport for decades, and over time the game has evolved significantly. In order to search for an edge, Football clubs have started to adopt promising data analytics techniques. Consequently, the evolution of the game is pushed even further [1]. The goal of this project was to build an assistive tool that could help coaches to simulate the actions of an “optimally behaving” defending team in response to attackers. We defined defensive objectives and expressed those in a cost function for the defending team.
During this work we made the following contributions:
- We formulate two defense objectives from spatiotemporal football models based on the literature.
- We propose a method to achieve these objectives by minimizing a cost function for the defending team.
- We propose a model that simulates future player positions of a defending team as a dynamic response to movements by the attacking team.
To quantify these objectives, we cooperated with a KNVB (Royal Dutch Football Association) football expert to verify the simulated behavior.
Proposed method
Football is a team sport and therefore we believe that a solution for a positional situation should be approached from the team perspective, rather than by considering eleven individual players’ viewpoints. We assume that the defending team reacts to the attacking team in an effort to neutralize or avoid dangerous situations. In cooperation with the football expert, we translated these objectives into state models with costs associated to each state. Expected defensive behavior is simulated by moving players over the football pitch in a cost minimizing fashion. Analysts and coaches could use this to inspect a situation of interest and to simulate an optimal defensive team solution, rather than focusing on individual player decisions.
We opted for two main objectives:
- Neutralizing the opponent’s pitch control, i.e., neutralizing the zonal control of attackers on the pitch.
- Decreasing the opponent’s chances for successful passes by limiting the passing options that opponents have.
We used the Pitch Control [2] and Pass Probability [3] models from the literature and associated the state of both models with a scalar cost to score the positioning of the defensive team. Visualizations of these costs are shown in Figs. 1 and 2.
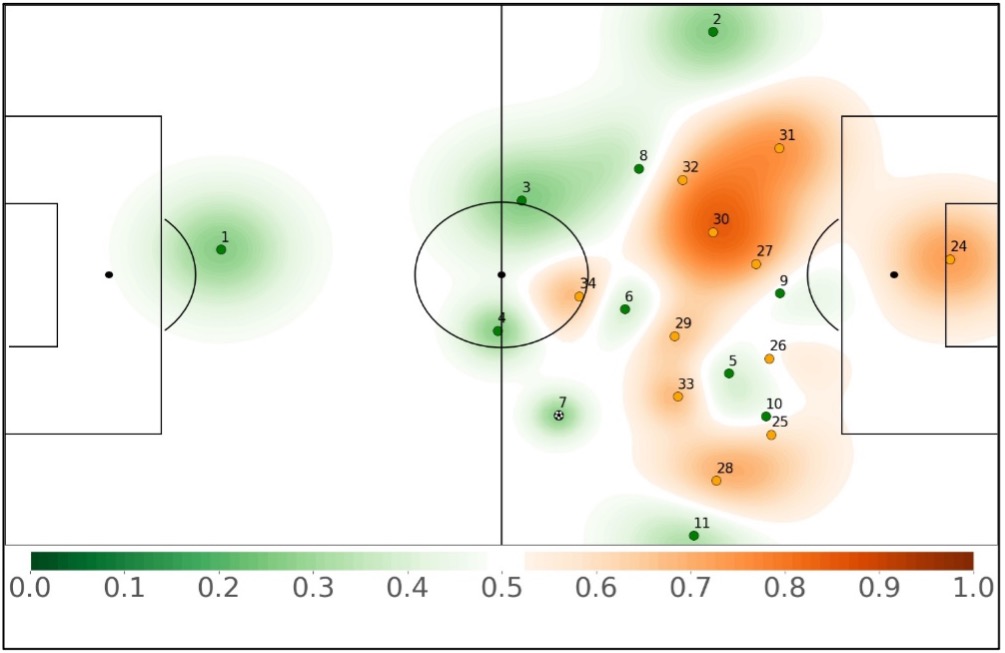
Visualization of the Pitch Control model. The green color expresses the zonal control of the attacking team, where the orange color expresses the zonal control of the defending team.
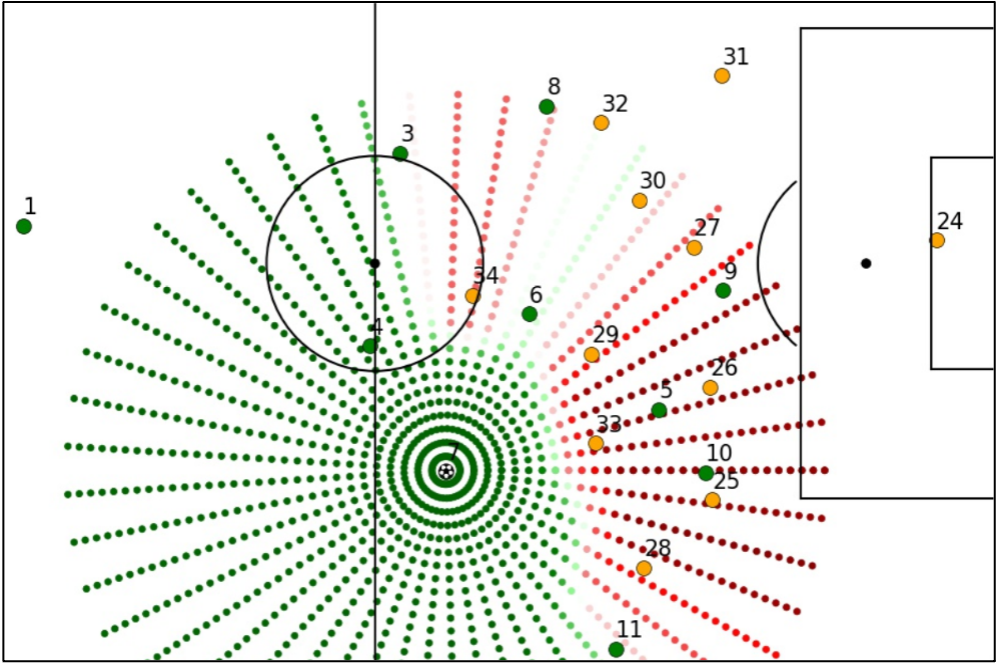
Visualization of the Pass Probability model. Green is most likely a clear pass-line, where red is most likely a blocked pass-line by the defenders.
Next, we combined weighted Pitch Control and Pass Probability costs into a single cost function to score defensive positioning. We then designed an algorithm that could move the defending players around according to their physical capabilities and limits. This algorithm moves the players of the defensive team dynamically to minimize the defensive cost. In this way, we simulated desired defensive team behavior that respond directly to the attacker decisions.
Illustration
To illustrate the working of our model, we simulated a line-breaking pass situation, shown in Fig. 3. The green circles are the original attackers. The orange circles are the original defenders, and the orange squares are the simulated defenders. We observe that the simulated players overall make useful decisions. For instance, midfielder 33 is putting pressure on the passing player, and wing back 28 is following his direct opponent. In general, players further away from the ball tend to make poorer decisions, according to the football expert. As for the center back and the right-wing back, according to our model they should prioritize more Pitch Control.
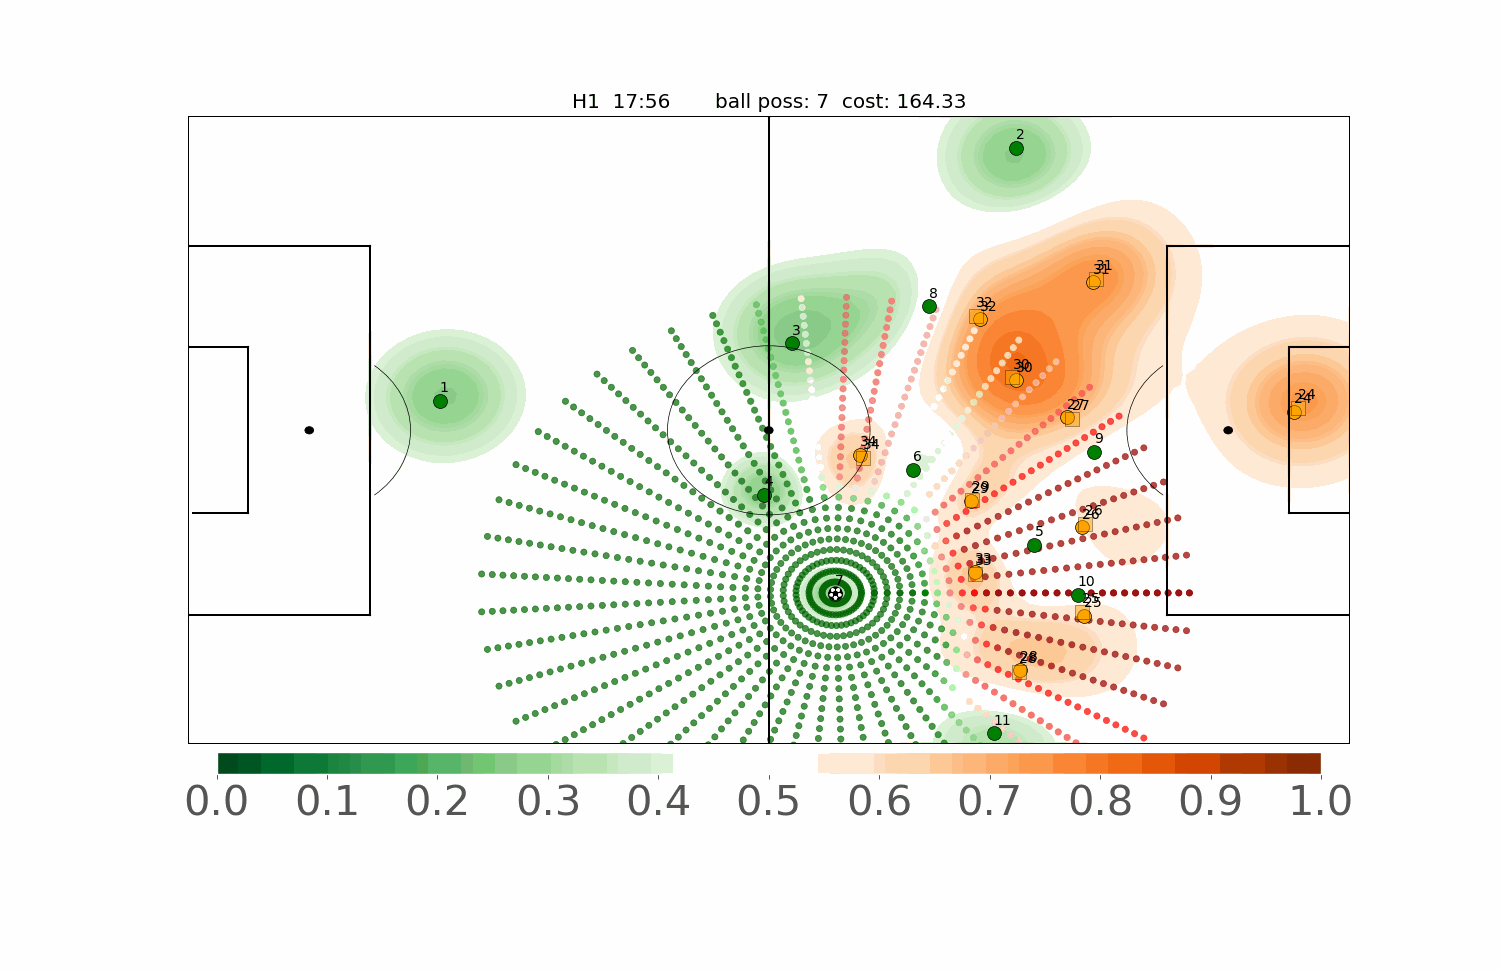
Illustration of defensive decision-making during a line-breaking pass. Green circles are the original attackers. Orange circles are the original defenders. Orange squares are the simulated defenders.
References
- D. Memmert and R. Rein, “Match analysis, Big Data and tactics: current trends in elite soccer,” Dtsch. Z. Für Sportmed., vol. 2018, no. 03, pp. 65–72, Mar. 2018
- J. Fernandez, F. C. Barcelona, and L. Bornn, “Wide Open Spaces: A statistical technique for measuring space creation in professional soccer,” p. 19, 2018.
- W. Spearman, A. Basye, G. Dick, R. Hotovy, and P. Pop, “Physics-Based Modeling of Pass Probabilities in Soccer,” p. 15, 2017.